Machine learning model
Machine learning is usually called ‘black box’ by layman. Well, we doubt that, but don’t forget our target, we aim to find the features that are related to good ratings and reviews most. Fine,then, we will use the ‘black box’ to find the underlying features, or in other words, to verify the features we have already analyzed above.
Support Vector Regressor Model
We will analyze the average rate as the output for regression by a popular supervised learning model, support vector regressor. Since there are 2 hyperparameters, gamma and penalty C. For each potential combination of 2 hyperparameters, we use support vector regressor with cross validation to get the mean square error of the chosen combination. The 3D terrain surface of grid search is shown, and we can choose the best combination of hyperparameters by getting to the ‘Cliff Bottom’.
Well, the model of support vector regressor may not be sufficient to reach the optimal effect of regression, but that’s enough in our story, which is to say, we care less about the accurate regression metric(mean square error in our case), but what we really try to get is the features for a hit movie.
Greedy Selection
We use greedy selection to iteratively select features one by one. Upon that, we get the features ranked by importance for predicting the Amazon ratings. Then how many features among them contain information that is sufficient for judging the ratings?
The performances with different numbers of features selected have a similar trend in validation set and test set. The curve flattens after feature number at 6 and then falls at around 10. The most obvious fall happen in the first several numbers, which is to say that the first 6 value features could predict the average rating with acceptable mean square value. So who are the stars? They are TMDB average vote, time and length of review text, price in Amazon, release time of movies and whether the movie title has changed. Wow! Most of the features conform to our intuitive analysis above, let’s take a glance at the prediction performance with only these features.
We can also observe that the main trend of the curves are similar, and the average distance between each testing data point is not far, which is to say our model with 6 selected features has an acceptable performance. Since our aim is not to make a perfect machine learning model, but to find the top features that affect rating most, the selected features through the model can comply to our goal.
Verification of TMDB Vote
Among the selected features, the most important feature in rank is, again, TMDB vote, which we have investigated in numerical analysis above. Now let’s take more look at this lovely feature. We let the TMDB vote and Amazon rating share the same range by division through a linear proportion, and represent for the changing trend by the value of (vote-rating)/rating. The distribution can be shown in a map.
Except in some areas in Africa, most countries have the 2 lightest colors among the threshold, and the value is around 0.Therefore, the value of vote does have a strong correlation with Amazon ratings, and can been seen as a linear relation, although it’s not strictly linear by some bias from the accurate value 0.
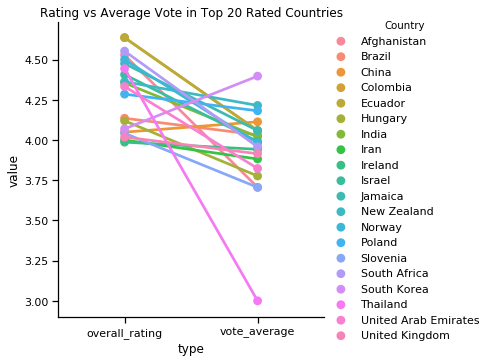
In another intuitive graph, most lines are parallel to each other, proving to have a not strictly linear relation. Nearly all countries have a lower value in average vote after dividing it by the proportion. It turns out compared to Amazon rating, TMDB vote is a bit more strict. The phenomena conform to our representation in the vote geographic distribution above.