Project for Applied Data Analysis 2018 - ZHOU Xiao & LIU Jiafan
Introduction
Today, movies are basically the most popular type of art and entertainment for us. People go to the cinema to watch a movie or buy it on Amazon, and give reviews and ratings on it. But for movie makers, movies are a type of business. Some blockbusters like “Avatar” have earned billions of dollars, while a lot of other movies are not as lucky as the highest-grossing ones. So we may wonder how to make a hit movie. We will try to use data analysis to answer this question. From the matadata, reviews, and ratings of movies, we would like to find factors and features that make a movie to become best seller on Amazon or take high revenues from the box office.
Dataset
For the project, the datasets we analyse are as follows:
Amazon reviews dataset contains totally 142.8 million product reviews (ratings, text, votes) and related metadata from Amazon. Among the huge data, we mainly use the ‘Movies and TV’ part for the implementation of our ideas.
TMDB movie dataset is a dataset we find on Kaggle. It contains metadata on thousands of movies, including the plot, cast, crew, budget, vote, revenues, etc.
Research questions
We’d like to answer these questions about movies and Amazon reviews:
What is the trend and evolution of movie ratings according to Amazon?
What is the correlation between TMDB vote and Amazon reviews?
Do good reviews and ratings lead to high revenues?
What are the factors and features that affect the ratings and sales of movies?
Descriptive statistics
To make a hit movie,various features are deserved for detailed analysis, both numerical and nonnumerical values. In this part, our aim is to get intuitive relations between Amazon rating and each potential feature.
Relation between Amazon Rating and Genres
When making movies, in addition to simple numbers like budget and revenue, nonnumerical values are also informative, for example, the genres of movies. In typical years , specific genres of movie tend to lead a fashion, and greatly affect the review, rating and other forms of evaluations towards a film. As master students in area of science and technology, interesting science fiction movies will always attract us, but we won’t have a chance to make a review on romance movie since all we need to love is data.
Drama has always been a leading trend in history, followed by comedy, and little attention is paid to foreign movies. The trend of other genres has been fluctuating through time and markets of movies for that are usually changing. Intuitively, a genre will affect the rating and review length of a movie since a hot type will attract more people and arouse their thoughts for more review texts, so average rating and review length of each genre will be analyzed.
Most genres share the close average ratings and science fiction movies are rated highest. However, visually there is no direct relation between average rating and review length among different genres, at least no linear relation. Well, it’s a little tricky, but we will focus on review later.
Intuitively, what are the evaluations other than ratings that can affect the quality of a movie? Yes, revenue, popularity and audience vote! So what’s the relation between genres and these values?
Now we do have a clearer view of what kind of movie can bring profit or reputation. But what’s the interconnection? Again, it’s tricky to answer, since a mere genre number of 20 is not sufficient for numerical-level analysis.
Relation between Amazon Rating and Directors
Director is also an important factor that lead to profit and review. Personally, if James Cameron directs a new movie, I will definitely go to the cinema for it and make my reviews after the payment. It’s called the influence of celebrity. Compared with other crew or cast in movie production, a director is perhaps the most important role in a movie, and we will analyze that. In case of randomness, we get the average ratings for all views of 20 directors that direct most movies.
Since these 20 directors participate in more movies than others, they have their own charms. All of them get a rating over 3.0 and most of them have a rating over 4.0, which can show their ability of directing movies to some degree, making them popular when making a movie.
Those directors are popular for other reasons, maybe they do not always make a movie that has a good reputation shown by vote, but they can bring the movie producers profits with great probability. The average profit proportion of these popular directors are all greater than 0, some even reach the profit proportion of 5! From the point of movie producers, they care about relation between revenue and budget most, which can be shown by the feature value of profit. Thus, making an invitation to popular directors lead to a shorter path for making profit.
Relation between Amazon Rating and Production Companies
Production companies of movies also lead to an intuitive thought, since they consist of a whole group of crew. Maybe some of them are not as famous as a hot director, their stable cooperation inside a mutual company will definitely affect the quality of a movie. Again, we focus on the distribution in top 10 productive companies to avoid randomness.
Large companies always lead to high revenue and high budget-to-revenue ratio as well. The top movie-maker company Warner Bros. lead to the highest average revenue, and making its role in the market of movie making. Also it seems that rating and vote have the same trend among these companies, since the shape of line plots are similar.
Geographic Distribution of Movie Rating
From the point of geographic distribution, a movie can also be affected by where it’s produced since different countries have different national economic conditions and lead to different average ratings of the movies.
Most areas have an average rating of about 3.5, and the average is especially higher in Europe, east Asia, north Africa, North America and India through the global map. But what are the specific strengths in each country? In other words, different kind of genres may conform to different distributions. For example, if we wish to watch animations, obviously Japanese animations are a great choice, but it will be too biased since lots of European countries pay little attention to animations. So let’s focus on comedy, an eternal component in the movie industry.
Most countries have the similar average rating with all movies, and it can be understood that these countries develop comedy movies with at least average efforts. However,colors become obviously lighter in China, Russia and South America, these areas are not good at making people laugh compared with other countries.
Relation between Amazon Rating and TMDB Vote
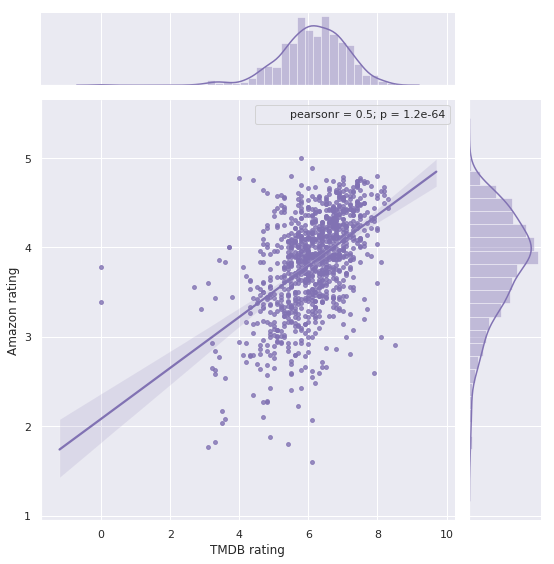
In the two datasets(Amazon and TMDB), we have two different ratings for a certain movie. One is from Amazon reviewers, which is a rating from 1 to 5 given on the movie products from Amazon. The other is from TMDB users, who usually should be movie fans who give a rating from 1 to 10 to the movies. What is the relation between these two ratings? We compared the two average ratings on each movie and made a scatter plot:
We saw a moderate positive correlation between the two ratings. This means the ratings on the two platforms are overall consistent.
Relation between Amazon Rating and Movie Budget/Revenue
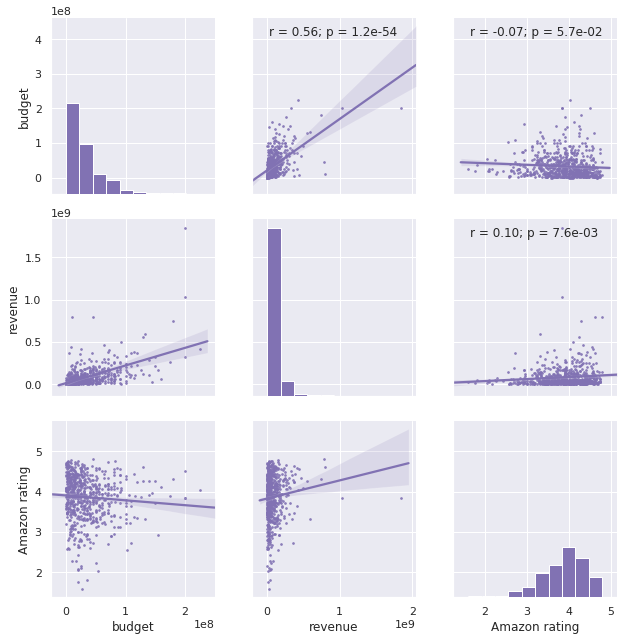
We are also interested in how budget and revenue of a movie correlates with its rating. Does high budget always lead to a blockbuster? We made a scatter plot for these three factors:
Do high budgets correlate with high ratings? No. There is a very weak negative correlation between budget and rating, so spending a lot of money doesn’t always makes a high-rating movie.
Do high revenues correlate with high ratings? Not really. The positive correlation is rather weak. So we can’t tell if a highest grossing movie can get good reputation.
And how about the relation between budgets and revenues? We noticed a moderate positive correlation between these two factors. Maybe movies are a kind of investment where you are able to get high returns with high budgets.
Text analysis
Since we have a large dataset of review texts, it’s necessary for us to apply some NLP methods on the texts.
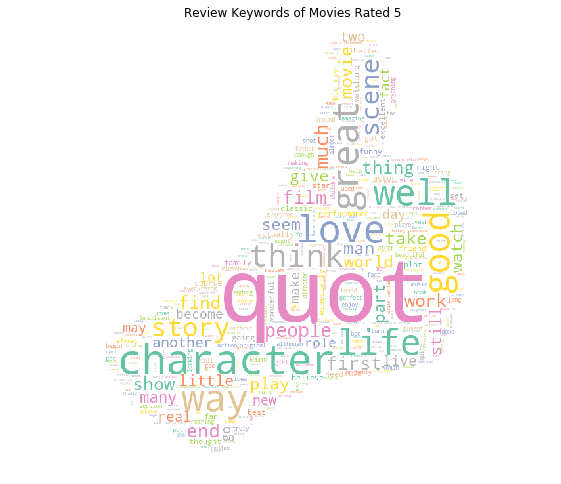
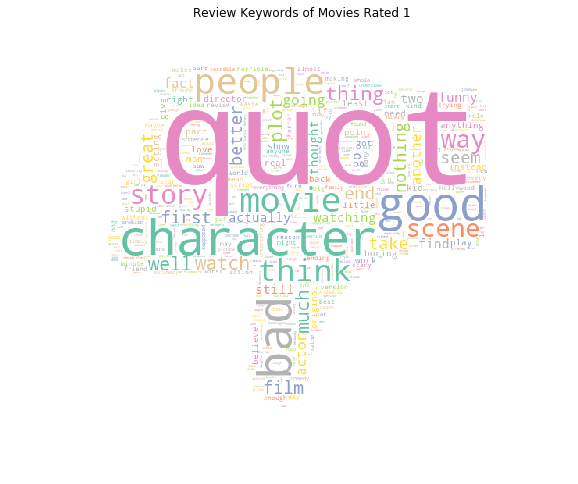
Review Keyword
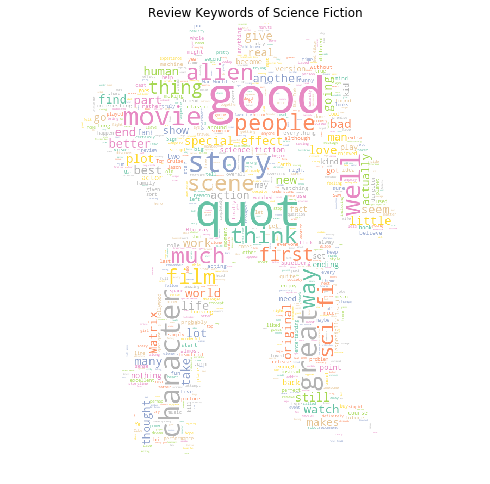
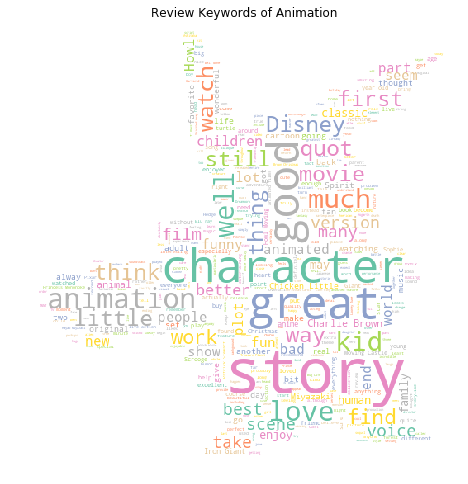
Firstly, let’s take a glance at the keywords in the review text. Review keywords of movies rated 1 and 5 can be visualized with the mask of thumb up and thumb down. We can also visualize the keywords of science fiction movies and animation movies with the masks of Transformers and Pikachu.
Well, from the visualization of review keywords, there are different specific words in specific genres (for example, ‘alien’ in science fiction and ‘disney’ in in animation). However, overall it’s hard to figure out the features of different reviews since mostly they contain similar words and we can not judge a review from the simple wordcloud figures. So later we will focus on more detailed text processing tools, nltk and make analysis inside the correlation between review text.
Sentiment Analysis
We have done sentiment analysis on each review text and got the corresponding positive, negative, neutral and compound scores. We calculated the average score for each rating group (from 1 to 5) to see what is the difference in sentiment of reviews with different ratings.
As we can see, as the rating goes up, the positive sentiment score is increasing and the negative sentiment score is decreasing. Overall, the compound sentiment score is increasing.
Part of Speech Tagging
We’ve tagged every word in the review texts with its part of speech(POS). We would like to know if all the POS tags have the same occurrence rate in each rating group. We normalized the occurence of a POS tag in a rating group by the total count of words in that group, and then calculated the distribution of each POS tag. Suppose a POS tag is uniformly distributed in each group, its percentage in each group should be about 20%. We made the boxplot of occurrence rate for each POS tag and the results are as follows:
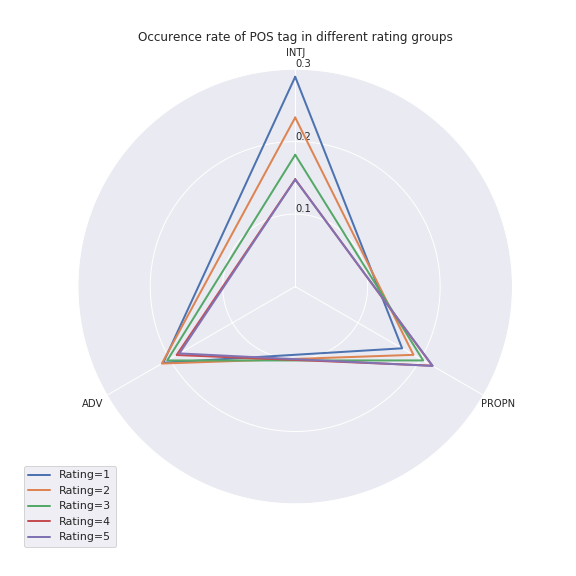
There are some POS tags with a high variance. We choose the three POS tags with the highest variance - INTJ(interjection), PROPN(proper noun), ADV(adverb), and see how their occurence is different in each rating group.
The distribution in rating=4 and rating=5 nearly overlap with each other. Apart from this, as the rating goes down, the occurence of INTJ and ADV is increasing, and the occurence of PROPN is decreasing. Maybe the reviewers who give a high rating are likely to talk about the movies, directors and actors (both are proper nouns) while the reviewers who give a low rating like using interjections and adverbs to express their bad feelings. The difference in INTJ is rather clear - more interjections in the negative reviews.
Machine learning model
Machine learning is usually called ‘black box’ by layman. Well, we doubt that, but don’t forget our target, we aim to find the features that are related to good ratings and reviews most. Fine,then, we will use the ‘black box’ to find the underlying features, or in other words, to verify the features we have already analyzed above.
Support Vector Regressor Model
We will analyze the average rate as the output for regression by a popular supervised learning model, support vector regressor. Since there are 2 hyperparameters, gamma and penalty C. For each potential combination of 2 hyperparameters, we use support vector regressor with cross validation to get the mean square error of the chosen combination. The 3D terrain surface of grid search is shown, and we can choose the best combination of hyperparameters by getting to the ‘Cliff Bottom’.
Well, the model of support vector regressor may not be sufficient to reach the optimal effect of regression, but that’s enough in our story, which is to say, we care less about the accurate regression metric(mean square error in our case), but what we really try to get is the features for a hit movie.
Greedy Selection
We use greedy selection to iteratively select features one by one. Upon that, we get the features ranked by importance for predicting the Amazon ratings. Then how many features among them contain information that is sufficient for judging the ratings?
The performances with different numbers of features selected have a similar trend in validation set and test set. The curve flattens after feature number at 6 and then falls at around 10. The most obvious fall happen in the first several numbers, which is to say that the first 6 value features could predict the average rating with acceptable mean square value. So who are the stars? They are TMDB average vote, time and length of review text, price in Amazon, release time of movies and whether the movie title has changed. Wow! Most of the features conform to our intuitive analysis above, let’s take a glance at the prediction performance with only these features.
We can also observe that the main trend of the curves are similar, and the average distance between each testing data point is not far, which is to say our model with 6 selected features has an acceptable performance. Since our aim is not to make a perfect machine learning model, but to find the top features that affect rating most, the selected features through the model can comply to our goal.
Verification of TMDB Vote
Among the selected features, the most important feature in rank is, again, TMDB vote, which we have investigated in numerical analysis above. Now let’s take more look at this lovely feature. We let the TMDB vote and Amazon rating share the same range by division through a linear proportion, and represent for the changing trend by the value of (vote-rating)/rating. The distribution can be shown in a map.
Except in some areas in Africa, most countries have the 2 lightest colors among the threshold, and the value is around 0.Therefore, the value of vote does have a strong correlation with Amazon ratings, and can been seen as a linear relation, although it’s not strictly linear by some bias from the accurate value 0.
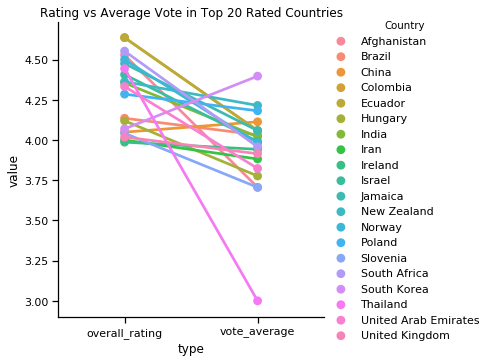
In another intuitive graph, most lines are parallel to each other, proving to have a not strictly linear relation. Nearly all countries have a lower value in average vote after dividing it by the proportion. It turns out compared to Amazon rating, TMDB vote is a bit more strict. The phenomena conform to our representation in the vote geographic distribution above.
Conclusion
The data story contains contention of a small part in our project. We mainly show the most representatives in our story, including descriptive statistics in both numerical and non-numerical features, review text analysis and machine learning models. There are many more details in our notebook. Several proofs have been made to verify our previous assumptions of useful features for hit movie making. However, there remain many details for improvement. For example, there is not enough data to further our hit movie analysis, and some methods and algorithms need to be improved. Anyway, we can say we find the generally intuitive features in movie industry, but many other factors always neglected should be taken into account, like title_change feature after greedy selection. Therefore, we will go into the area of further deep data analysis in the future.
Morning Fog Emerging From Trees by A Guy Taking Pictures, on Flickr